Activity Bank
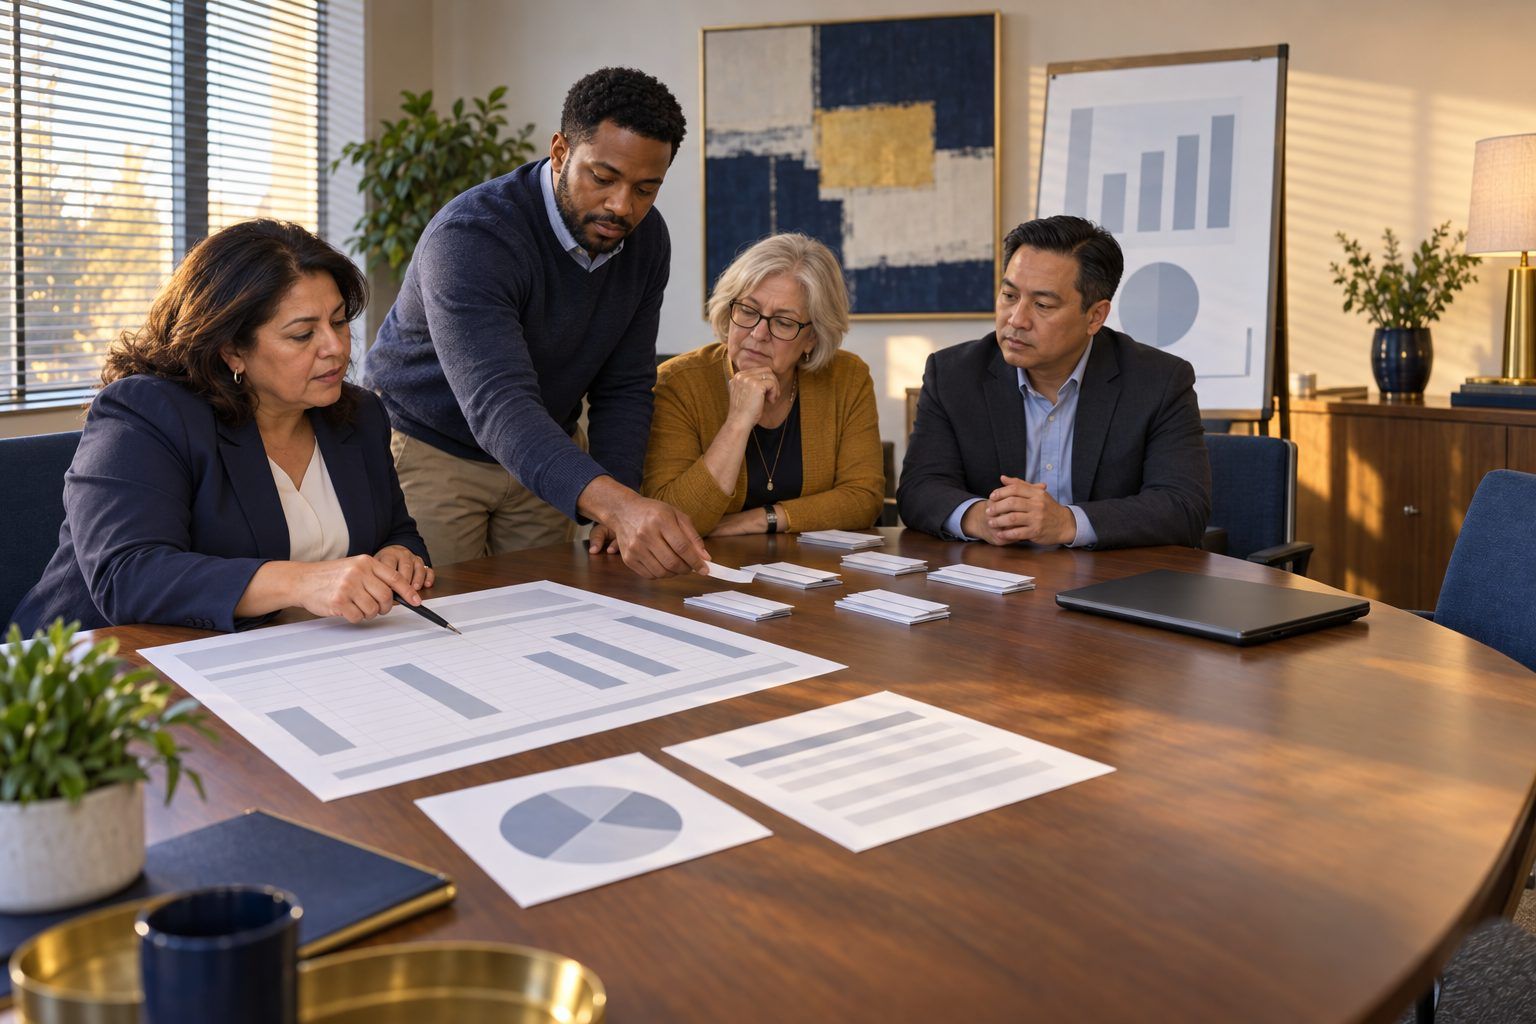
A school leadership team sorts classroom screen uses into purpose piles beside a printed data table.

All activities Professional learning

Minutes With a Purpose: A Screen Time Audit

Teams audit a fictional district's school-device minutes by purpose, not just by total, and draft grade-band guidance that protects unplugged time and asks for evidence of learning.

Print handouts

Overview

Texas HB 1481 (2025) settled the personal-phone question for the school day, and it explicitly leaves out devices the district provides. How much and how well students use school-issued devices is still your district's call. In this audit, teams read a fictional district's device-use snapshot critically, sort real-feeling classroom uses by purpose (creating, researching and collaborating, practicing with feedback, or just watching), and apply the 2026 ELE question: "What evidence shows the technology improved the learning?" They leave with draft grade-band guidance and an honest, privacy-safe plan to gather their own local data. The goal is intentional, age-appropriate use judged by learning, not a blanket cut.

Objectives

  • Participants will name at least three things a device-minutes report cannot tell them about learning, attention, or purpose.
  • Participants will sort classroom device uses by purpose and justify each placement with the evidence of learning it produces, or fails to produce.
  • Participants will draft grade-band guidance (K–2, 3–5, 6–8, 9–12) that prioritizes creating over consuming and protects unplugged time.
  • Participants will plan a local data collection that looks at purpose as well as minutes and includes specific privacy safeguards.

Materials

On paper

  • Handout A: Pecan Creek ISD Device-Use Snapshot (fictional), 1 per person
  • Handout B: Purpose Sort (1 set per team, strips cut apart) plus the facilitator key
  • Handout C: Grade-Band Guidance Drafter, 1 per team (extras for individuals)
  • Chart paper with three columns: "It tells us / It can't tell us / We'd ask"; markers; sticky notes in two colors

On screen

  • Optional: one device per team with a shared copy of the Handout A table in a spreadsheet the district approves
  • Optional: a projector for the snapshot and the five-question check

Before you start

  1. Print Handout A for everyone and cut Handout B into strips (one set per team). Keep the facilitator key for yourself.
  2. Draw the three-column chart ("It tells us / It can't tell us / We'd ask") and a second chart titled "Five-question check" with the five leader questions written down the side.
  3. Skim the three sources in Connections so you can answer questions accurately: the HB 1481 bill text (the personal-device definition and its exclusion of district-provided devices), the Common Sense Census (2021), and the American Academy of Pediatrics' 2026 policy statement.
  4. If you want the digital path, paste the Handout A table into a shared spreadsheet and make one copy per team.

Step by step

  1. 10–5 min

    Hook

    One number, three reactions

    Project one line from Handout A: "Pecan Creek ISD (fictional): grades 9–12 students average 185 minutes a day on school-issued devices." Ask people to stand on a line: too much on one end, too little on the other, can't tell in the middle. Ask two people from each spot why they stood there. Then say: "Texas HB 1481 (2025) required every district to adopt a policy on students' personal communication devices during the school day, and it specifically excludes devices the district provides. So nobody in Austin is going to answer the 185-minute question for us. It's ours. Today we answer it with purpose and evidence, not a gut reaction to a big number."

    Facilitator notePeople who stood in the middle are usually right, and saying so early lowers the temperature. The rest of the session turns "can't tell" into "here's what we'd need to know."

  2. 25–17 min

    Explore

    Read the snapshot like a skeptic

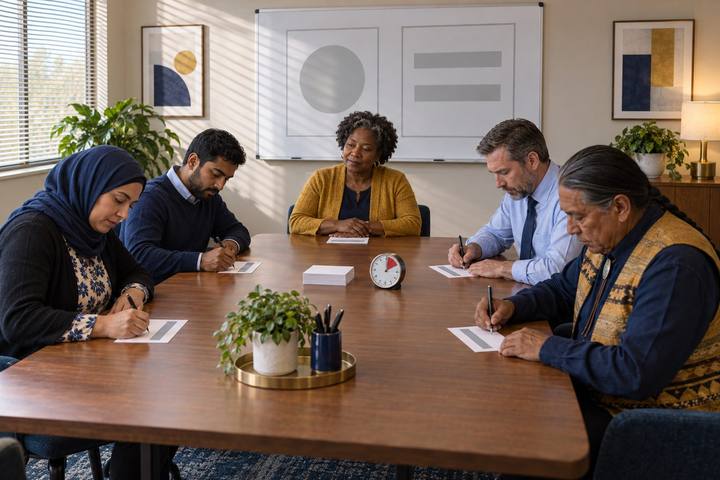
    Teams read Handout A, including the notes and the four voices at the bottom. On sticky notes, they fill the three-column chart: It tells us (what the report actually measured), It can't tell us (what it's silent on), and We'd ask (the question they'd put to the tech office or a teacher). Prompt with: "Is a minute in front of a window the same as a minute of attention? Who decided which category an app belongs to? What happened on the benchmark day?" After 8 minutes, each team reads its best "can't tell" note aloud.

    Facilitator noteLook for the big three: minutes are not learning, logged time is not attention (a window in front can be ignored), and purpose was assigned by app name, not by what students did. If no one spots that K–2 minutes come from shared carts divided by enrollment, point to the notes row. If someone brings up national figures, be precise: the Common Sense Census (2021) found that tweens averaged 5 hours 33 minutes and teens 8 hours 39 minutes of entertainment screen media a day, not counting screens used for school or homework. Those figures describe life outside school and can't be compared with Handout A. No independent national measure of school-device minutes exists, so don't let anyone imply one.

  3. 317–23 min

    Model

    Think aloud: two strips that fool the report

    Place Handout B's four category headers on the table. Think aloud with Strip 5 (the documentary with three stop-and-write points): "The device report filed this under consume/watch because it was a video site. But students stopped three times to write a claim and evidence. The purpose is research. The evidence is on their papers, not in the log." Then Strip 4 (adaptive math app, teacher never adjusts groups): "This is practice with feedback for the student. But the feedback loop stops at the student. If no adult acts on the report, we're not getting the learning we're paying minutes for." Say: "Sort by what students do and what evidence it leaves, not by the app."

    Facilitator noteThis is the core move of the audit. Purpose belongs to the task, not the tool.

  4. 423–37 min

    Practice

    Sort, then ask the evidence question

    Teams sort the remaining strips, reading each aloud and saying why before placing it. Then each team chooses the three strips they argued about most and, for each one, answers the 2026 ELE question on a sticky note: "What evidence shows the technology improved the learning?" They mark each of the three Keep, Redesign (same device, better task), or Unplug (paper, talk, or hands-on would produce better evidence). Share one Redesign per team.

    Facilitator noteExpect the most debate on Strips 4, 5, 10, and 13. Keep the tone practical: "Consume/watch" is not a verdict on a teacher. A short video can launch a great lesson. The audit question is whether the minutes were attached to a task that left evidence.

  5. 537–55 min

    Create

    Draft grade-band guidance

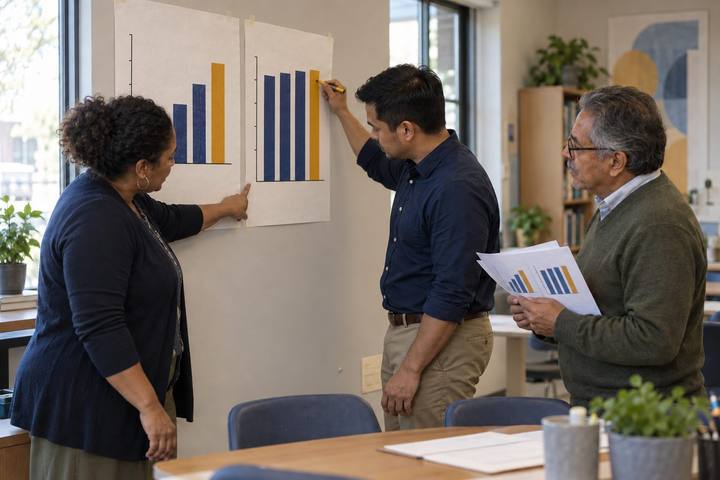
    Each team member takes one grade band on Handout C (K–2, 3–5, 6–8, 9–12). For 8 minutes, they draft alone: which purposes to prioritize, what stays unplugged, and what evidence of learning a principal or coach would look for. Then the team reads all four bands in order and checks the progression: Does creating grow as students get older? Is there protected unplugged time in every band? Does K–2 guidance fit how young children actually learn (hands, talk, play)? Finish the vision line and the "Who might be left out?" box together. Share the framing from the American Academy of Pediatrics' 2026 policy statement, which moves guidance beyond simple screen-time limits toward quality, context, and conversation: "That's our lens too. We're describing good use, not only counting minutes."

    Facilitator noteTeams sometimes want to write a minute cap and attribute it to pediatricians. Don't let that happen: the AAP's 2026 statement is about quality, context, and conversation, not an hour limit for school. If a team sets a local target, label it plainly as a local decision and say what evidence would make you revise it. In the "left out" box, look for students whose IEP or 504 plan calls for assistive technology, emergent bilinguals who rely on translation or read-aloud tools, and students without home internet.
  6. 655–65 min

    Apply

    Plan to gather your own data, honestly

    Say: "The snapshot was fictional. Your real data doesn't exist yet in the form you need." Teams complete the local data plan on Handout C by choosing at least two of three sources: a teacher time study (a sample of teachers note, for one week, when devices were used, for what purpose, and what evidence it produced), student logs (grades 3–12 students record purpose in one tap or one line; K–2 teachers log for the class), and device reports (aggregate only, read with today's skepticism). For each source they write the question it answers and one limitation. Then they write their privacy safeguards: collect only what the question needs, report by grade band or campus rather than by student or teacher, say who can see the raw data, and set a date to delete it.

    Facilitator notePush back on any plan that uses device logs to evaluate individual teachers or students. A time study only works if teachers trust it's for learning about the system, not for evaluating them.

  7. 765–70 min

    Debrief

    The five-question check

    Point to the five-question chart. Each team puts a sticky dot next to the question its draft answers least well: What is the vision? What evidence will guide us? What changes in instruction? Who might be left out? How will families understand the change? Read the dot pattern aloud. Close: "Families will hear 'screen time' and think phones and home. Our job is to explain the difference between minutes and purpose so they can trust the guidance."

    Facilitator note"How will families understand the change?" is usually the thinnest. The companion activity Screens at School, Screens at Home is a ready-made family session for exactly that.

Paper or screen

Unplugged

Everything runs on paper: Handout A is the data, Handout B is a physical sort, and Handout C is the drafter. Teams that want to see how the story changes when minutes are re-sorted by purpose can use the "re-tag" move: they cross out the report's category for a row of Handout A and write their own estimate in the margin, then total by hand. The debate about what a minute means is identical with or without a spreadsheet.

Digital

Give each team a shared spreadsheet copy of the Handout A table. After the sort, teams re-tag two or three categories based on what they learned (for example, moving part of 9–12 "consume/watch" to research because of documentary-with-stops lessons) and chart minutes by purpose for each grade band. In a virtual session, run the sort as a drag-and-drop slide per team in breakout rooms, collect "can't tell" notes on a shared board, and have each team paste its grade-band draft into one shared document for comparison.

Does it need a screen? The spreadsheet lets teams watch the "story" in a chart flip as soon as a category is re-tagged, which is the clearest proof that a minutes report reflects someone's labeling choices. The judgment work (sorting by purpose and naming evidence) is just as strong on paper.

Evidence of learning

What you should be able to see or collect if it worked.

  • The "It can't tell us" column names specific limits (logged time is not attention, categories assigned by app, shared carts, the benchmark day), not just "it's incomplete."
  • Sort placements are justified by what students did and what evidence it left, and at least one strip is re-tagged from the report's category to a different purpose.
  • Each grade band on Handout C names protected unplugged time and at least one concrete piece of student evidence (a revised draft, a sourced claim, an explanation recorded in a student's own words).
  • The local data plan combines at least two sources, states one limitation of each, and lists safeguards: aggregate reporting, limited access, and a deletion date.

Adaptations

Campus leadership team
Replace Handout A with your campus's own aggregate device report (grade band or campus level only, no names) after doing the fictional version first, so people practice skepticism before it's personal.
Coaches
Turn the teacher time study into a coaching cycle: listen to what a teacher wants to know, co-plan one lesson that shifts consume minutes to create minutes, model it, measure the student evidence, and adjust. Ask: "What changed in teacher practice or student evidence?"
Short on time (35 min)
Skip the Model step, sort only Strips 1–8, and have each team draft one grade band instead of four.
Single-level campus
Split your grade band into two (for example, grade 6 and grades 7–8) so the progression discussion still happens.

Standards connections

Leaders and coaches audit fictional school-device minutes by purpose, draft grade-band guidance, and plan privacy-safe local data collection.

TEKS
data literacy, management, and representationprivacy, safety, and security (c)(10)TEKS sections: Technology Applications §126.5–§126.7, §126.8–§126.10, §126.17–§126.19, high school Technology Applications courses (19 TAC Chapter 126)

See how all activities align

Reflect

  • What evidence will guide our device-use decisions, and how will we know if a change improved learning rather than just lowering minutes? (Leader ELE 3.0)
  • Where in our schools are device minutes attached to tasks that leave no evidence of learning?
  • Who might be left out if we cut minutes across the board, and how does our guidance protect them? (Leader ELE 4.0)
  • How will we explain the difference between minutes and purpose to families?

Take it to your students

Within two weeks, run a one-week teacher time study with three to five volunteer teachers per grade band using the purpose categories from Handout B. Bring the aggregate results and three pieces of student work to your leadership team or PLC and revise your grade-band draft based on what you find.

Pairs well with